| |
STATGRAPHICS Centurion 丨 数据分析软件培训 |
| |
 班级人数--热线:4008699035 手机:15921673576/13918613812( 微信同号) 班级人数--热线:4008699035 手机:15921673576/13918613812( 微信同号) |
| 增加互动环节,
保障培训效果,坚持小班授课,每个班级的人数限3到5人,超过限定人数,安排到下一期进行学习。 |
| 授课地点及时间 |
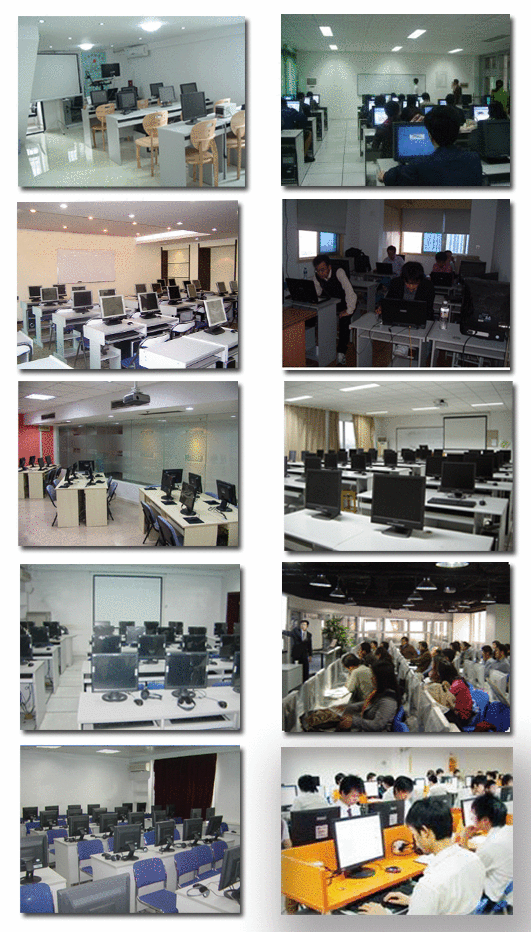
上课地点:【上海】:同济大学(沪西)/新城金郡商务楼(11号线白银路站) 【深圳分部】:电影大厦(地铁一号线大剧院站)/深圳大学成教院 【北京分部】:北京中山/福鑫大楼 【南京分部】:金港大厦(和燕路) 【武汉分部】:佳源大厦(高新二路) 【成都分部】:领馆区1号(中和大道) 【广州分部】:广粮大厦 【西安分部】:协同大厦 【沈阳分部】:沈阳理工大学/六宅臻品 【郑州分部】:郑州大学/锦华大厦 【石家庄分部】:河北科技大学/瑞景大厦
开班时间(连续班/晚班/周末班):2026年07月13日....推荐就业....实战、实操....从入门到精通....全国连锁..精准匹配专家..专家培训...用心服务.....良心教育....参加培训,提升专业技能....课程再次升级....学用相长,注重实践....以质量求发展....合作共赢....实用实战....用心服务..........--即将开课--........................(欢迎您垂询,视教育质量为生命!) |
| 课时 |
◆资深工程师授课
☆注重质量
☆边讲边练
☆若学员成绩达到合格及以上水平,将获得免费推荐工作的机会
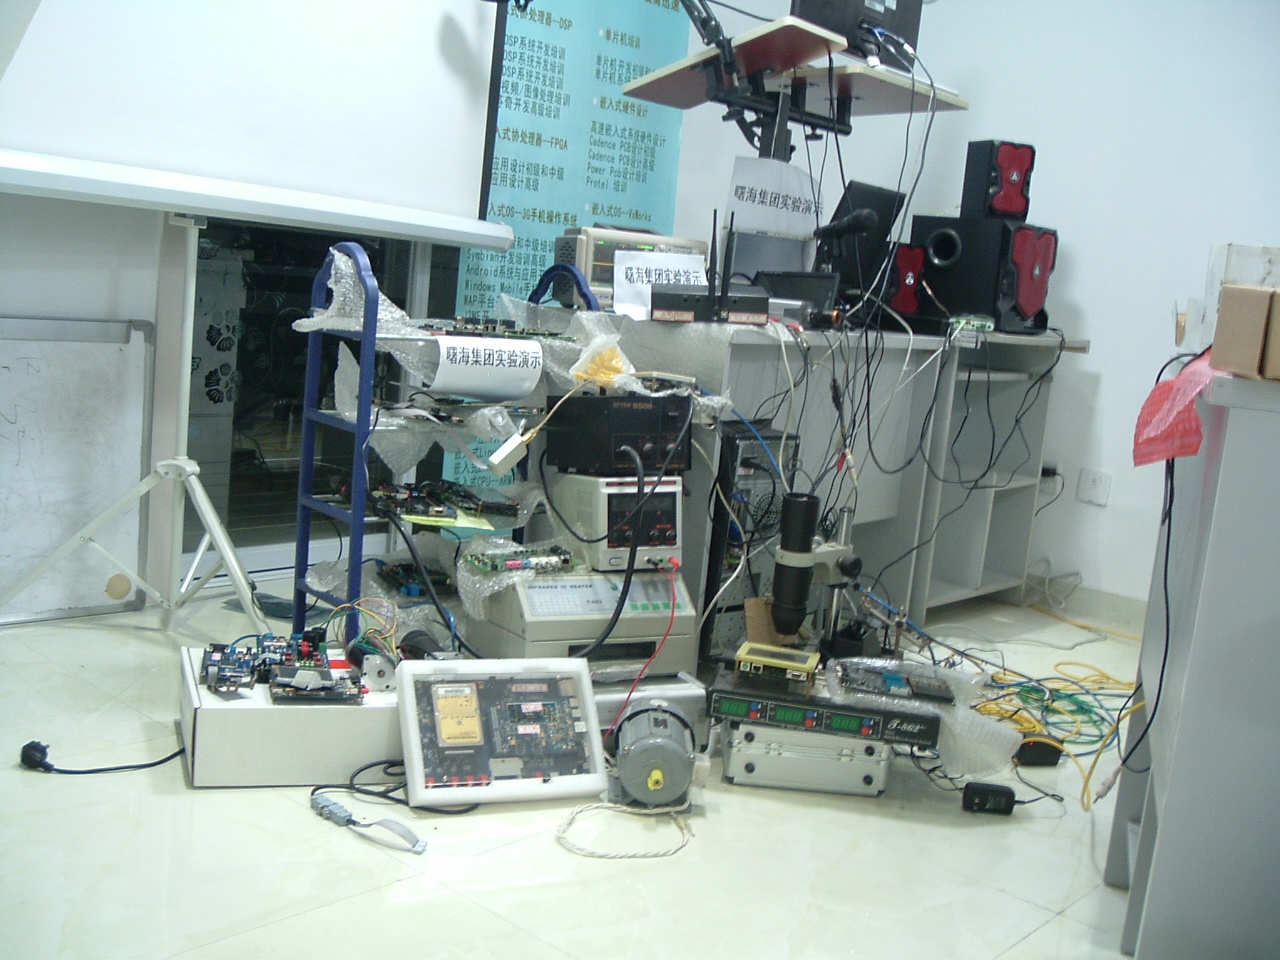
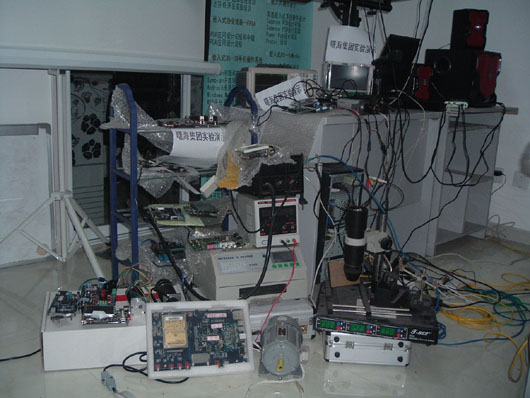
★查看实验设备详情,请点击此处★ |
| 质量以及保障 |
☆
1、如有部分内容理解不透或消化不好,可免费在以后培训班中重听;
☆ 2、在课程结束之后,授课老师会留给学员手机和E-mail,免费提供半年的课程技术支持,以便保证培训后的继续消化;
☆3、合格的学员可享受免费推荐就业机会。
☆4、合格学员免费颁发相关工程师等资格证书,提升您的职业资质。 |
☆课程大纲☆ |
| |
- 不论您是小区域或是大区域所要的地图建立,MapViewer提供您功能强大且容易使用的工具,并且将您的数据完美的显现出来。特色:可做地图编辑,地图投影可选各种地球坐标投影系统Albers Equal Area、Miller Cylinder、Latiitude/Longitude,统计图型有Hatch、Dot Density Pie,Symbbol、Prism,具有图型重迭功能可结合Surfer,文字可用上下标数学符号、线型符号,颜色都可定义,数据输入可用Lotus、Excel、ASCII,图型输出可选CGM,DXF、BMP、GIF、EPS、HPGL等。
-
-
- MapViewer可以绘制以下图形
-
- 1、Base Maps基本地图
- 基本地图包括没有任何数据表示的边界。可以与其他地图使用实现显示的功能,比如道路,河流,城市位置,边界这些没有相关的数据等等。
-
- 2、Pin Maps 引脚图
- 引脚图是点位置图,在地图上的特定位置画一个点
-
- 3、Hatch Maps孵化图
- 孵化图使用颜色和填充图案来表示地图上每个区域的数据范围或类别。
-
- 4、Density Maps密度图
- 密度图也叫做点密度图,用符号来表示地图上的数据值。
-
- 5、Gradient Maps梯度图
- 梯度图在离散数据点之间通过插值显示连续的颜色。
-
- 6、Dorling Cartograms统计图
- 统计数据通过改变大小的相关区域对象来表示的值。Dorling 统计图用圆取代了原来的图形
-
- 7、Symbol Maps符号地图
- 符号地图在地图的一个区域,曲线或者点的位置上放置一个缩放符号,符号按比例缩放比例为每个区域或点所代表的数据值。
-
- 8、Territory Maps
- Territory地图组进入领土,并且为每组对象相关的数据提供统计信息
-
- 9、Pie Maps饼图
- 饼图是一种用按比例大小来表示多个数据值的方法
-
- 10、Bar Maps条形图
- 条形图是通过绘制一个条形图来表示各个位置的数据值的一种方法
-
- 11、Line Graph Maps线形图
- 线形图表示每个位置的中心线图
-
- 12、Prism Maps 棱镜图
- 棱镜图绘制每个区域、曲线或点作为凸起的棱镜,棱镜的高度与相关的数据值相关联
-
- 13、Flow Maps流向图
- 流向图是基于线的厚度来表示数据。
-
- MapViewer主要特性
-
- 1、创建专业专题地图
- 控制你的空间数据。 MapViewer强大的绘图功能将空间数据转换为信息专题地图。灵活的地图显示,即时自定义和高级分析使MapViewer成为GIS分析师,商业专业人士以及任何处理空间分布数据的人的首选工具。
-
- 2、增强地图
- 创建像智能一样美丽的地图。 MapViewer丰富的自定义选项可让您创建地图以清晰地传达您的消息。
-
- 3、做出明智的决定
- 利用MapViewer的地理处理工具,对空间数据做出更好,更明智的决策。重点关注感兴趣的领域,缩小部分以进行进一步分析,并对原始数据应用数学计算以发现新的见解。
-
- 4、与所有坐标系无缝协作
- MapViewer可以轻松将空间数据转换为信息图。 MapViewer轻松管理投影在不同或多个坐标系中的未参考数据和数据。
-
- 5、即时访问在线数据
- 大量的数据在您的指尖等待可视化。 MapViewer可让您立即访问从任何在线Web地图服务(WMS)(公共或私人)下载的地图。
-
- 6、完全兼容
- 无缝可视化并分析来自多个来源的数据。 MapViewer本地读取多种文件格式,包括SHP,DXF和XLSX。 MapViewer还支持许多流行的导出格式。
-
- 7、与自信合作
- 与客户,同事和利益相关者分享您的工作。地图可以用高质量的导出格式(如PDF或TIFF)打印出版物。或者,您可以使用网络兼容格式(如JPG或PNG)在线共享您的作品。如果您正在准备演示文稿,只需将您的地图复制并粘贴到演示文稿工具中,例如Microsoft PowerPoint或Word。
-
- 8、简化的工作流程
- MapViewer直观的用户界面使您可以在几分钟内从原始数据转到信息图。
-
-
- 系统要求
- Windows XP SP3或更高版本,Vista SP3或更高版本,7,8(不包括 RT),10或更高版本
- 支持32位和64位操作系统
- 1024 x 768或更高的显示器分辨率,至小16位色深
- 至少500MB 可用硬盘空间
- 至少512MB RAM
-
-
- Overview
-
-
- MapViewer is an affordable mapping and spatial analysis tool that allows you to easily produce publication-quality thematic maps. Precisely display your data distribution with the most intuitive functions and features. Your data is unique and you need the best mapping software for the job!
- MapViewer is an affordable and mapping and spatial analysis tool that allows you to easily produce publication-quality thematic maps. No data set is too complex to make an eye-catching plot. MapViewer helps you discover data trends and patterns in your data to help you make the right decision every time!
-
- Create one of more than 16 unique and fully-customizable map types. Color your boundaries based on a data variable with the hatch map and territory map types. Create unique bar charts, pie charts, or line/scatter plots in each boundary with the bar map, pie map, and multi-graph map types. Grid your data and create gradient maps, contour maps, and vector maps from the grid. Re-size your map areas based on a data value with the three cartogram map types (contiguous, non-contiguous, and dorling) and the prism map type. Use the density map, symbol map, flow map, and line graph map types to display points, line graphs, or arrows on your map based on your data value. Add base maps and pin maps to your plot to display boundaries and point locations on your thematic maps.
-
- What's New in MapViewer 8?
- We have compiled a list of some of the top new features in MapViewer 8. This list is only a small sampling of the new features added to MapViewer 8.
-
- New and Improved User-Interface
Find commands more easily than ever with the new ribbon bar user-interface. Commonly-used commands have larger icons to make them easier to find, and commands are grouped in more intuitive ways. Additionally, find customization tools more easily than ever in the newly-redesigned managers.
- "I would like to congratulate you and your team on the new version of MapViewer. It looks great." – Kazimierz J Zaniewski, Ph.D., Professor of Geography, Geography and Urban Planning, University of Wisconsin Oshkosh
-
-
- Create Multi-Graph Maps
Multi-graph maps are a new thematic map type that display a unique line graph in or on each map boundary. Multi-graph maps make it easy to compare continuous information (like population over time) for multiple areas at once.
- "It was easy to use this Multi-Graph Map. This will be very handy for mapping with oil and gas production data." – Mike Brickey, Retired Geologist
-
-
- Create Bivariate Symbol Maps
Symbol Maps have been an effective means of communicating data in previous versions of MapViewer, but they are even more powerful in MapViewer 8. Now you can color your symbols by a different variable than the variable with which you sized the symbols. This new feature doubles the amount of information your map conveys!
- “My first effort at a bivariate symbol map produced a good map quickly and easily.” – David Hillier, Retired Plant Ecologist
-
-
- Create Contiguous Cartogram Maps
Contiguous cartograms are maps that vary the area of a map boundary based on a variable, and maintain the connectivity of adjacent boundaries at the expense of shape. Use this intriguing new cartogram map feature to display your data in an obvious and interesting way.
- “I LOVE the contiguous cartogram…very elegant.” – Bob McConnaughey, Ph.D., Epidemiology Support and Analysis, Research Triangle Park, NC, USA
-
-
- Create Proportional Pin Maps
Exercise full control over your pin map display by using the proportional symbol size pin map method. This allows you to set a minimum and maximum symbol size, then have the symbol sizes vary within that range based on the values in your data column.
- “I mainly use Pin maps for our organization…In the new version I see a benefit to be able to use multiple data sources. This is a great feature.” – MapViewer 8 Beta Tester
-
-
- Download Online Maps
More information is now at your fingertips. Download image layers from hundreds of free online Web Mapping Services (WMS) through MapViewer’s new, integrated WMS browser. Connect to online data sources, pick the layers of interest you want to download, and MapViewer seamlessly downloads the images into your projects.
-
- Query Across Multiple Layers
No longer are you limited to querying only objects in the same layer. Now select points from one layer that are within boundaries on another layer, apply properties to polygons on separate layers that share a given criteria, etc. MapViewer will show you patterns in your data you never knew existed!
-
- Use Text Columns for Territory Map Territories or Hatch Map Classes
It’s finally here! Create the same visually-dynamic hatch maps and territory maps you always have, but use text variables rather than assigning these to data values. Eliminate tedious data reformatting forever!
- “I didn't use text classes in my work but I must say it's very efficient. … I must confess it seems very powerful and much more useful than I thought. Congratulations.” – Thierry Hatt, associated researcher EA3400 team, historical GIS cartographer, Université de Strasbourg, France
-
- Increased Customization of Data Labels
Customize your map presentation by adding data labels from any data column, changing the font/format of labels, moving all labels in as set or individual labels, and adding leader lines. Your maps will look exactly how you want with minimal effort!
- "Using the new approach to dealing with data labelling was straightforward and intuitive. The flexibility and range of facilities provided are very good." – John Cooper, retired Professor and Property Systems consultant
-
- Support for Unlimited Number of Attributes
Import an unlimited number of attributes with your boundaries for use as data labels to present a myriad of information about your map.
-
- Embed Data in MapViewer Project (GSM) Files
Have trouble remembering where your data files went? Forget to send the data files with the GSM file when you’re sharing your project with a coworker or technical support? Never again. The redesigned GSM file allows you to embed data so one file is all you need!
-
- Improved Coordinate System Dialog
Benefit from a flexible new coordinate system dialog that lays out the systems in a more intuitive fashion. Additionally, new functionality has been added to search for coordinate systems to make it easier than ever to find your desired system. Surfer users will find this dialog familiar and will delight in the improvement, since this dialog and Surfer’s are one and the same.
-
- Font/Format Support for Legend Entries
Add a custom legend to your plot to give all of the information that your audience needs to get out the valuable information you put into your maps. Use the new Font Properties and Label Format sections to add prefixes and suffixes to your legend entries, modify the font size and color, and so much more!
-
- New Import/Export Formats
Take advantage of the newly available or enhanced import and export formats!
- Import formats:
Google Earth KML/KMZ
Excel XLSX
JPEG2000 (JP2)
SEG-P1 (as data or base map)
Excel XLSM
Access 2007
MrSID
GPX
LASer LiDAR data
PDF as raster
Increase DPI
TerraGo GeoPDF
Zipped SHP
AutoCAD DXF (as data
ECW
TIF
Tiled -import all tiles at once
Support YCbCr Color Format
56-bpp Landsat based GeoTIFF
Newer (450/4.5 and 600/6.0) MIF
Import bitmap at original DPI
-
- Export formats:
Google Earth KML/KMZ
Option to export text as 'label' placemarks instead of icons or areas/curves
Excel XLSX
JPEG2000 (JP2)
SEG-P1
SVG
GeoPDF
Transparent TIF/PNG/GIF/PDF
Vector PDF with layers
HTM
PDF
Support compression
Page size option
Vector - support partial transparency for image fill patterns
Support compression, page size option
BLN - Add Blanking Flag Options to the BLN Export Options Dialog
GSI - save symbol properties, fill patterns, and coordinate system info internally
Improved export of stock fill patterns
-
- New Coordinate Systems, Datums, and Projections
New Coordinate Systems:
- Bursa-Wolf (7-parameter) Transformation Version of the CH1903 Coordinate System
WGS84 Web Mercator (900913) and WGS84 Web Mercator (EPSG 3857)
Europe UTM zone 29N using European 1950 - Port./Spain datum
British National Grid & Ordnance Survey (OSGB36)
More Australian grid coordinate systems
New Zealand Transverse Mercator 2000
Australian GDA94 with GDA94 datum
Michigan GeoRef (1point+azimuth)
France: RGF93 / CC (zones 42-50)
ITM: Irish Transverse Mercator
Hungarian National Grid EOV
Taiwan TWD67 and TWD97
Portuguese National Grid
WGS84 Web Mercator
Kentucky Single Zone
Swiss LV95 and LV03
South African Grid
Irish National Grid
Japan Plane Rect.
Russia Pulkovo
Sweref99
Posgar94
SVY21
ISG
-
- New Datums:
- apanese Geodetic Datum 2000
D_Hartebeesthoek_1994
Potsdam 1983 (PD83)
NGO 1948
NWS-84
ITRF94
-
- New Projections:
- New Zealand Map Grid
- Mount Eden Circuit 2000
Support Ordnance Survey
Hotine Oblique Mercator 2-Point
SCOPQ (MTM)
Gauss-Boaga
-
- 64-Bit Installation Option
"I have created my very first 1.28 Gbyte Mapviewer8 file. I certainly could never have done that in Mapviewer7!" – Jim Lance, Independent Geophysicist
- Full Transparency Control of All Map Objects Including Images
Full Unicode Support
New Text Editor Dialog
And many more!
|
|
|
|
 合作伙伴与授权机构 合作伙伴与授权机构 |

Altera全球合作培训机构
|
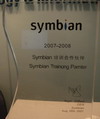
诺基亚Symbian公司授权培训中心 |

Atmel公司全球战略合作伙伴
|

微软全球嵌入式培训合作伙伴 |

英国ARM公司授权培训中心 |

ARM工具关键合作单位 |
|
|
|
| 我们培训过的企业客户评价: |
曙海的andriod 系统与应用培训完全符合了我公司的要求,达到了我公司培训的目的。
特别值得一提的是授课讲师针对我们公司的开发的项目专门提供了一些很好程序的源代码, 基本满足了我们的项目要求。
——上海贝尔,李工
曙海培训DSP2000的老师,上课思路清晰,口齿清楚,由浅入深,重点突出,培训效果是不错的,
达到了我们想要的效果,希望继续合作下去。
——中国电子科技集团技术部主任 马工
曙海的FPGA 培训很好地填补了高校FPGA培训空白,不错。总之,有利于学生的发展,
有利于教师的发展,有利于课程的发展,有利于社会的发展。
——上海电子,冯老师
曙海给我们公司提供的Dsp6000培训,符合我们项目的开发要求,解决了很多困惑我
们很久的问题,与曙海的合作非常愉快。
——公安部第三研究所,项目部负责人李先生
MTK培训-我在网上找了很久,就是找不到。在曙海居然有MTK驱动的培训,老师经验
很丰富,知识面很广。下一个还想培训IPHONE苹果手机。跟他们合作很愉快,老师很有人情味,态度很和蔼。
——台湾双扬科技,研发处经理,杨先生
曙海对我们公司的iPhone培训,实验项目很多,确实学到了东西。受益无穷
啊!特别是对于那种正在开发项目的,确实是物超所值。
——台湾欧泽科技,张工
通过参加Symbian培训,再做Symbian相关的项目感觉更加得心应手了,理
论加实践的授课方式,很有针对性,非常的适合我们。学完之后,很轻松的就完成了我们的项目。
——IBM公司,沈经理
有曙海这样的DSP开发培训单位,是教育行业的财富,听了他们的课,茅塞顿开。
——上海医疗器械高等学校,罗老师
|
| 我们新培训过的企业客户以及培训的主要内容: |
| |
广州航天航空 POWERPC培训
桂林航天工 DSP培训
江苏五维电子科技 达芬奇培训
无锡步进电机自动控制技术 DSP培训
江门市安利电源工程 DSP培训
长江力伟股份 CADENCE 培训
爱普生科技(无锡 ) 数字模拟电路
河南平高 电气 DSP培训
中国航天员科研训练中心 A/D仿真
常州易控汽车电子 WINDOWS驱动培训
南通大学 DSP培训
上海集成电路研发中心 达芬奇培训
北京瑞志合众科技 WINDOWS驱动培训
江苏金智科技股份 FPGA高级培训
中国重工第710研究所 FPGA高级培训
芜湖伯特利汽车安全系统 DSP培训
厦门中智能软件技术 Android培训
上海科慢车辆部件系统EMC培训
中国电子科技集团第五十研究所,软件无线电培训
苏州浩克系统科技 FPGA培训
南京南瑞集团技术 FPGA培训
西安爱生技术集团 FPGA培训,DSP培训
成都熊谷加世电气 DSP培训
福斯赛诺分析仪器(苏州) FPGA培训
南京国电工程 FPGA培训
北京环境特性研究所 达芬奇培训
中国科微系统与信息技术研究所 FPGA高级培训
重庆网视只能流技术开发 达芬奇培训
无锡力芯微电子股份 IC电磁兼容
河北科研究所 FPGA培训
上海微小卫星工程中心 DSP培训
上海申达自动防范系统 FPGA培训
四川长虹佳华信息 MTK培训
公安部第三研究所--FPGA初中高技术开发培训以及DSP达芬奇芯片视频、图像处理技术培训
上海电子信息职业技术--FPGA高级开发技术培训
上海点逸网络科技有限公司--3G手机ANDROID应用和系统开发技术培训
格科微电子有限公司--MTK应用(MMI)和驱动开发技术培训
南昌航空大学--fpga 高级开发技术培训
IBM 公司--3G手机ANDROID系统和应用技术开发培训
上海贝尔--3G手机ANDROID系统和应用技术开发培训
中国双飞--Vxworks 应用和BSP开发技术培训
一汽海马汽车 DSP培训
苏州金属研究院 DSP培训 |
台湾欧泽科技--iPhone开发技术培训
宝康电子--Allegro Candence PCB 仿真和信号完整性技术培训
上海天能电子有限公司--Allegro Candence PCB 仿真和信号完整性技术培训
上海亨通光电科技有限公司--andriod应用和系统移植技术培训
上海智搜文化传播有限公司--Symbian开发培训
先先信息科技有限公司--brew 手机开发技术培训
鼎捷集团--MTK应用(MMI)和驱动开发技术培训
傲然科技--MTK应用(MMI)和驱动开发技术培训
浙江理工大学--Dsp6000图像/视频处理技术培训
台湾双阳科技股份有限公司--MTK应用(MMI)和驱动开发技术培训
滚石移动--MTK应用(MMI)和驱动开发技术培训
冠捷半导体--Linux系统开发技术培训
奥波--CortexM3+uC/OS开发技术培训
迅时通信--WinCE应用与驱动开发技术培训
海鹰医疗电子系统--DSP6000图像处理技术培训
博耀科技--Linux系统开发技术培训
华路时代信息技术--VxWorks BSP开发技术培训
中软国际--Linux系统开发技术培训
龙旗控股集团--MTK应用(MMI)和驱动开发技术培训
研祥智能股份有限公司--MTK应用(MMI)和驱动开发技术培训
罗氏诊断--Linux应用开发技术培训
西东控制集团--DSP2000应用技术及DSP2000在光伏并网发电中的应用与开发
科大讯飞--MTK应用(MMI)和驱动开发技术培训
东北农业大学--IPHONE 苹果应用开发技术培训
中国电子科技集团--Dsp2000系统和应用开发技术培训
中国船舶重工集团--Dsp2000系统开发技术培训
晶方半导体--FPGA初中高技术培训
肯特智能仪器有限公司--FPGA初中高技术培训
哈尔滨大学--IPHONE 苹果应用开发技术培训
昆明电器科学研究所--Dsp2000系统开发技术
奇瑞汽车股份--单片机应用开发技术培训
东华大学--Dsp6000系统开发技术培训
上海理工大学--FPGA高级开发技术培训
同济大学--Dsp6000图像/视频处理技术培训
上海医疗器械高等专科学校--Dsp6000图像/视频处理技术培训
中航工业无线电电子研究所--Vxworks 应用和BSP开发技术培训
北京交通大学--Powerpc开发技术培训
上海水务建设工程有限公司--Alter/Xilinx FPGA应用开发技术培训
恩法半导体科技--Allegro Candence PCB 仿真和信号完整性技术培训
中国计量--3G手机ANDROID应用和系统开发技术培训
冠捷科技--FPGA芯片设计技术培训
芬尼克兹节能设备--FPGA高级技术开发培训
川奇光电--3G手机ANDROID系统和应用技术开发培训
|
|
|
|
|


 shuhaipeixun
 1299983702
 总部李老师
总部李老师